PaperBanana: Google Taught Neural Networks to Generate Publication-Quality Charts
You've ever seen a PhD student cry before a Nature or Science deadline? Usually it happens at three in the morning, when the Matplotlib package once again refuses to align the chart legend, and the methodology diagram in Adobe Illustrator looks like a first-grader's drawing. Until today, the automation of science has gone down the path of text and computation: neural networks have learned to write literature reviews, propose hypotheses, and even code. But visual communication — that very "pretty picture" that explains the essence of a discovery in five seconds — remained purely human labor. Researchers from Google and Peking University decided it was time to change that and presented PaperBanana. The problem of visualization in science runs deeper than it appears. It's not just a matter of aesthetics. A scientific graph must be accurate, scalable, and meet strict publication standards.
AI-processed from MarkTechPost; edited by Hamidun News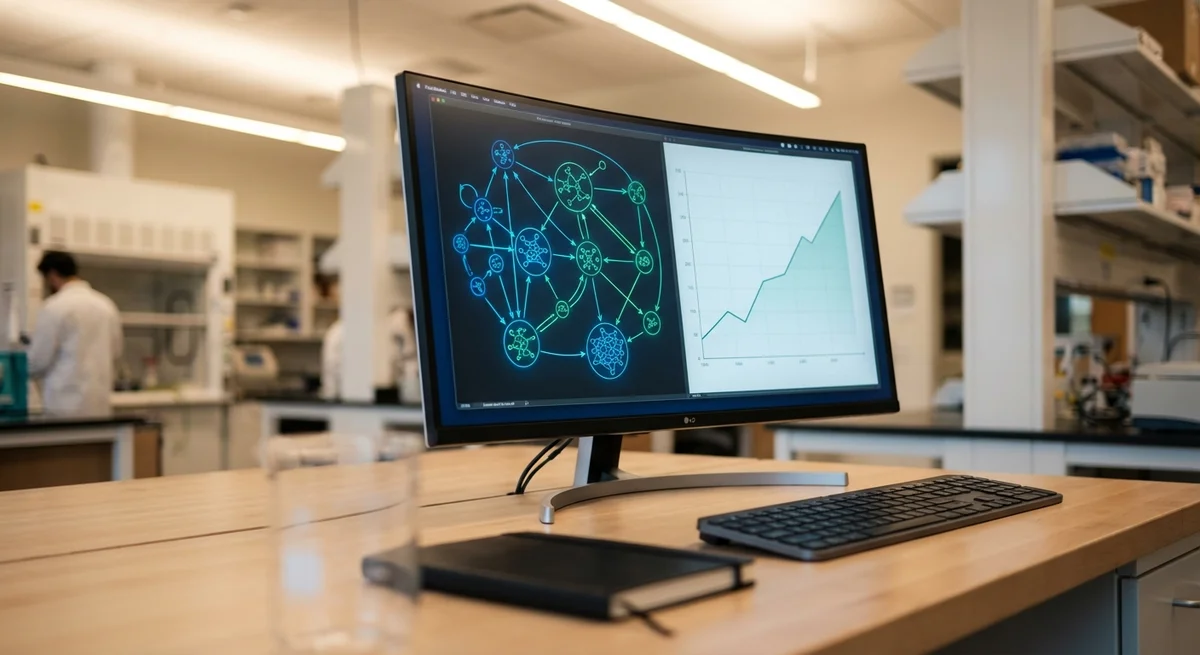
Google, together with Peking University, has unveiled PaperBanana — a multi-agent system that automates the creation of methodology diagrams and statistical charts for scientific publications. The development is reported by MarkTechPost.
The problem of scientific visualization
A scientific chart must be accurate, scalable, and compliant with strict publication standards. Ordinary generative models like DALL-E are not suited to this task: they hallucinate data and do not understand the logic of an experiment. Previously, the automation of science mainly concerned text and computation — neural networks learned to write literature reviews, propose hypotheses, and code — but visualizing results remained manual labor.
How PaperBanana works
Instead of handing the drawing task to a single neural network, PaperBanana distributes it among specialized agents: one plans the structure of the diagram, a second writes the code to render it, and a third critiques the result — checking whether the axes are mixed up and whether the fonts are legible. This is a hierarchical structure that mimics the work of a small design studio.
Context: tools for AI research
Projects like Sakana AI's AI Scientist have already shown that a neural network can carry out research from idea to paper draft, but such work stumbled at the visualization stage. Google, competing with OpenAI and Anthropic for tools aimed at developers and researchers, is closing this gap with a framework oriented toward an academic audience.
Open questions on ethics and quality
If a paper is entirely generated by AI, including its data visualizations, the question arises of how reviewers can verify the reliability of that data. Charts in PaperBanana are built on real figures, but the very ease of creating them could trigger a flood of low-quality, "beautifully packaged" publications.
What does PaperBanana do?
PaperBanana is a multi-agent framework from Google and Peking University that automates the creation of methodology diagrams and statistical charts for scientific publications.
Why aren't ordinary generative models like DALL-E suited for scientific charts?
They hallucinate data and do not understand the logic of an experiment, whereas a scientific chart must be accurate, scalable, and compliant with strict publication standards.
How are roles distributed among the agents in PaperBanana?
One agent plans the structure of the diagram, a second writes the code to render it, and a third critiques the result — checking whether the axes are mixed up and whether the fonts are legible.
Want to stop reading about AI and start using it?
AI News is a curated feed of AI/tech news. Hamidun Academy teaches you to use AI systematically in your work.
The AI world, distilled — once a week
Seven stories that actually mattered, hand-picked. No noise, no reposts, no press releases.
Done! Check your inbox for a confirmation.