Claude from Anthropic now generates charts and interactive diagrams directly in chat
Anthropic has updated Claude: it now generates charts, diagrams, and interactive visualizations directly during a conversation. If the model determines that an image will explain something better than words, it inserts it inline. For example, a question about the periodic table turns into a clickable visualization with details for each element.
AI-processed from The Verge; edited by Hamidun News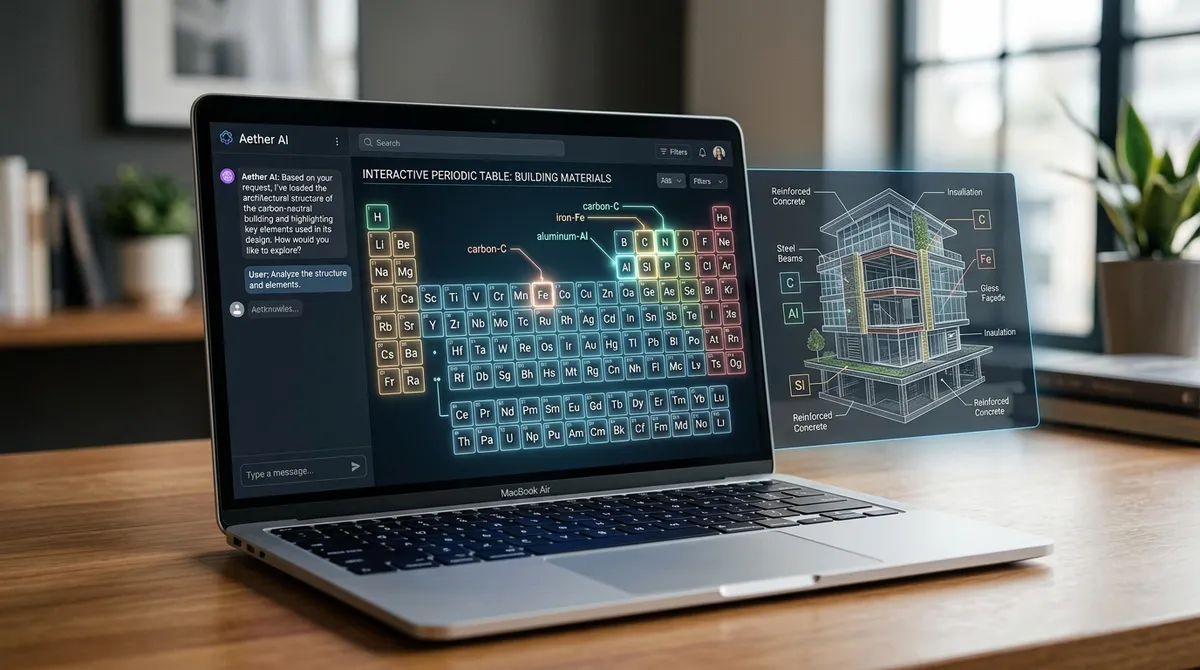
Anthropic has released an update to Claude that changes the traditional text-based format of AI conversations: the bot can now independently generate charts, diagrams, and interactive visualizations directly within the chat. Previously, Claude could offer code to build a graph or describe data in text. Now, if the model recognizes that a visual representation of information would be more useful, it inserts an image inline — not in a sidebar, but directly in the conversation stream.
The examples provided by Anthropic are illustrative. A question about the periodic table of chemical elements — and Claude builds an interactive table where you can click and get detailed information about each element. A question about how load is distributed through load-bearing building structures — and the answer becomes a diagram with marked force flows.
This is no longer just a text-based assistant. An important detail: visualization launches automatically when Claude itself decides it's appropriate. Users don't need to specifically ask "draw a diagram" — the model evaluates the context and makes the decision independently.
This approach brings Claude closer to a data analysis tool, rather than just a chatbot. The feature appears against the backdrop of growing competition in the segment: OpenAI and Google are also actively developing multimodal capabilities for their models. However, inline generation of interactive elements directly in the chat is a step that sets Anthropic's update apart.
For practical application, this means the following: users will be able to receive structured visual answers to analytical, educational, and technical questions without needing to switch to third-party tools like Excel or Tableau. This is especially valuable in education, where complex concepts are better understood through diagrams, and in business analysis, where data needs to be seen, not just read about. Anthropic is consistently expanding Claude's capabilities beyond text.
Visualizations are a logical next step toward making the model a full-fledged working tool, rather than just a source of information.
Need AI working inside your business — not just in your newsfeed?
I build production AI for companies — custom CRM, internal tools, autonomous agents, workflow automation. Owned by you, shaped to your process, no per-seat tax. Built by Zhemal Khamidun, CPO of AlpinaGPT (AI platform, 6,000+ users).
The AI world, distilled — once a week
Seven stories that actually mattered, hand-picked. No noise, no reposts, no press releases.
Done! Check your inbox for a confirmation.